|
OpenLB 1.7
|
Loading...
Searching...
No Matches
|
OpenLB 1.7
|
#include <gnuplotWriter.h>
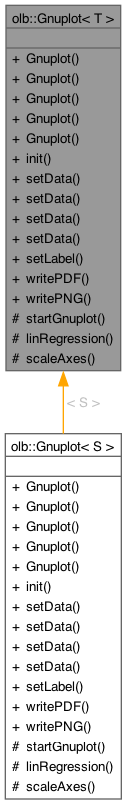
 Inheritance diagram for olb::Gnuplot< T >: Collaboration diagram for olb::Gnuplot< T >:
Public Types | |
| enum | AxisType { LINEAR , LOGLOG , LOGLOGINVERTED } |
| enum | Regression { OFF , LINREG } |
| different types of data usage and axes scaling More... | |
Public Member Functions | |
| Gnuplot (std::string name, bool liveplot, std::string preCommand, AxisType axisType, Regression regressionType) | |
| type of Regression, off, LINear REGression, exponential Regression?,... | |
| Gnuplot (std::string name) | |
| overload the constructor using delegating constructors. | |
| Gnuplot (std::string name, bool liveplot) | |
| Gnuplot (std::string name, AxisType axisType) | |
| Gnuplot (std::string name, AxisType axisType, Regression regressionType) | |
| void | init () |
| initialises the data file | |
| void | setData (T xValue, T yValue, std::string name="", std::string key="", char plotType='l') |
| sets the data and plot file for two doubles (x and y) the plotType indicates whether the user want to plot a line graph (default = 'l') or e.g. | |
| void | setData (bool noXvalue, T yValue, std::string name="", std::string key="", char plotType='l') |
| if no x value is given, it is just an increasing integer | |
| void | setData (T xValue, std::vector< T > yValues, std::vector< std::string > names={""}, std::string key="right", std::vector< char > plotType={ 'l', 'l'}) |
| sets the data and plot file for a double and a vector of doubles (x and {y1,y2,...}) for each entry of the y-axis-list, a plot Type can be specified (default: line graph {'l', 'l'}) | |
| void | setData (bool noXvalue, std::vector< T > yValues, std::vector< std::string > names={""}, std::string key="right", const std::vector< char > plotType={ 'l', 'l'}) |
| if no x value is given, it is just an increasing integer | |
| void | setLabel (std::string xLabel="", std::string yLabel="") |
| set labels of the plot: xLabel and yLabel | |
| void | writePDF (std::string plotName="") |
| writes an PDF | |
| void | writePNG (int iT=-1, double xRange=-1, std::string plotName="") |
| writes PNGs usage: first argument: numbering of png file (optional), second argument: range for the x axis (optional) third argument: name the plot in order to specify a plotID in case the user want to create more than one plot with the simulation results no arguments: writes in one file with adaptive xrange and no specific name | |
Protected Member Functions | |
| void | startGnuplot (std::string plotFile, std::string plotName="") |
| system command to start gnuplot (LINUX ONLY!) | |
| void | linRegression (std::ofstream &fout, std::string x_axisType, std::string y_axisType) |
| creates the lin regression to the data | |
| void | scaleAxes (std::ofstream &fout) |
| scales the axes if needed | |
Definition at line 36 of file gnuplotWriter.h.
| enum olb::Gnuplot::AxisType |
| enum olb::Gnuplot::Regression |
different types of data usage and axes scaling
| Enumerator | |
|---|---|
| OFF | |
| LINREG | |
Definition at line 40 of file gnuplotWriter.h.
| olb::Gnuplot< T >::Gnuplot | ( | std::string | name, |
| bool | liveplot, | ||
| std::string | preCommand, | ||
| AxisType | axisType, | ||
| Regression | regressionType ) |
type of Regression, off, LINear REGression, exponential Regression?,...
Constructor with name of outputFiles boolean true for real-time plotting //WARNING: experimental!
Constructor with name for output files boolean true for real-time plotting //WARNING: experimental! Every set of paramters has its own constructor which is delegating the "large constructor"
Definition at line 39 of file gnuplotWriter.hh.
|
explicit |
overload the constructor using delegating constructors.
This has the advantage that there is no necessity for default values which might cause some trouble
Definition at line 61 of file gnuplotWriter.hh.
| olb::Gnuplot< T >::Gnuplot | ( | std::string | name, |
| bool | liveplot ) |
Definition at line 64 of file gnuplotWriter.hh.
| olb::Gnuplot< T >::Gnuplot | ( | std::string | name, |
| AxisType | axisType ) |
Definition at line 67 of file gnuplotWriter.hh.
| olb::Gnuplot< T >::Gnuplot | ( | std::string | name, |
| AxisType | axisType, | ||
| Regression | regressionType ) |
Definition at line 70 of file gnuplotWriter.hh.
| void olb::Gnuplot< T >::init | ( | ) |
initialises the data file
|
protected |
creates the lin regression to the data
create lin Regression to the given Datasets in the given scaling, e.g.
loglog, logloginverted, linear,.... The kind of scaling is provided by the parameters xAxisType and yAxisType
plotting the data and for each set 1:2 / 1:3,... the lin regression is plotted IMPORTANT the word "plot" must be included in every kind of regression used in the context auf the plotting
Definition at line 129 of file gnuplotWriter.hh.
|
protected |
scales the axes if needed
scales the axes if necessary to add new kinds of scaling, just add another case, the labels for the x and y axes will be expanded by the kind of scaling (if it's other than linear) this labeling provides a labeling of the axes even if the function setLabel isn't specifically called
Difference between LOGLOG and LOGLOGINVERTED is just 1/N in the x-axes
this command will change the tics-labels, the {%.2f} is replaced by the original tic-label using two
digits after the comma
Definition at line 153 of file gnuplotWriter.hh.
| void olb::Gnuplot< T >::setData | ( | bool | noXvalue, |
| std::vector< T > | yValues, | ||
| std::vector< std::string > | names = {""}, | ||
| std::string | key = "right", | ||
| const std::vector< char > | plotType = {'l','l'} ) |
if no x value is given, it is just an increasing integer
writes the data and plot file for a double and a vector of doubles (x and y1,y2,...), where x is increasing integer
Definition at line 179 of file gnuplotWriter.hh.
| void olb::Gnuplot< T >::setData | ( | bool | noXvalue, |
| T | yValue, | ||
| std::string | name = "", | ||
| std::string | key = "", | ||
| char | plotType = 'l' ) |
if no x value is given, it is just an increasing integer
writes the data and plot file for two doubles (x and y), where x is increasing integer
Definition at line 83 of file gnuplotWriter.hh.
| void olb::Gnuplot< T >::setData | ( | T | xValue, |
| std::vector< T > | yValues, | ||
| std::vector< std::string > | names = {""}, | ||
| std::string | key = "right", | ||
| std::vector< char > | plotType = {'l','l'} ) |
sets the data and plot file for a double and a vector of doubles (x and {y1,y2,...}) for each entry of the y-axis-list, a plot Type can be specified (default: line graph {'l', 'l'})
writes the data and plot file for a double and a vector of doubles (x and y1,y2,...) plotType indicates whether you want a linegraph 'l' (default) or a scatterplot 'p': (default: {'l','l'}) The position in the vector 'plotType'{'l', 'p'} is linked to the rank of the y-axis (y1, y2) : y1 is plotted in form of a line plot & y2 is plotted in form of a scatterplot
Definition at line 95 of file gnuplotWriter.hh.
| void olb::Gnuplot< T >::setData | ( | T | xValue, |
| T | yValue, | ||
| std::string | name = "", | ||
| std::string | key = "", | ||
| char | plotType = 'l' ) |
sets the data and plot file for two doubles (x and y) the plotType indicates whether the user want to plot a line graph (default = 'l') or e.g.
writes the data and plot file for two doubles (x and y) plotType indicates whether you want a linegraph 'l' (default) or a scatterplot 'p' (default: 'l')
a scatter plot ('p')
Definition at line 76 of file gnuplotWriter.hh.
| void olb::Gnuplot< T >::setLabel | ( | std::string | xLabel = "", |
| std::string | yLabel = "" ) |
set labels of the plot: xLabel and yLabel
set Label of the gnuplotPlot; xLabel and yLabel
Definition at line 352 of file gnuplotWriter.hh.
|
protected |
system command to start gnuplot (LINUX ONLY!)
system command to start gnuplot (LINUX ONLY!) plotName indicates the name of the plot in case the user wants to create more than one plot with the simulation results (default: plotName = "")
Definition at line 363 of file gnuplotWriter.hh.
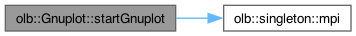
References olb::singleton::mpi().
Here is the call graph for this function:| void olb::Gnuplot< T >::writePDF | ( | std::string | plotName = "" | ) |
writes an PDF
Definition at line 189 of file gnuplotWriter.hh.
| void olb::Gnuplot< T >::writePNG | ( | int | iT = -1, |
| double | xRange = -1, | ||
| std::string | plotName = "" ) |
writes PNGs usage: first argument: numbering of png file (optional), second argument: range for the x axis (optional) third argument: name the plot in order to specify a plotID in case the user want to create more than one plot with the simulation results no arguments: writes in one file with adaptive xrange and no specific name
writes PNGs usage: first argument: numbering of png file second argument: range for the x axis thrid argument: specifies the name of the plot in case the user wants to create more than one plot with the simulation results (default: plotName = "") no arguments: writes consecutive numbers with adaptive xrange
initialize the writePlotFile for Gnuplot with the type and the name of the output data
Definition at line 206 of file gnuplotWriter.hh.